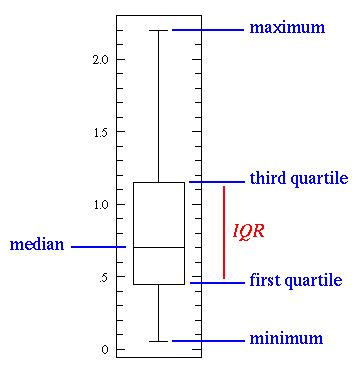
 This image is an example of a box plot. A box plot, or box and whisker diagram, provides a simple graphical summary of a set of data and is a standardized way of displaying the distribution of data based on the five number summary: minimum, first quartile, median, third quartile, and maximum. It shows a measure of central location the median), the average, and measures of dispersion. In the simplest box plot the central rectangle spans the first quartile to the third quartile (the interquartile range or IQR). A segment inside the rectangle shows the median and "whiskers" above and below the box show the locations of the minimum and maximum. Box plots are especially useful when comparing two or more sets of data.
 Monday, July 21, 2008
BOX PLOT
 This image is an example of a box plot. A box plot, or box and whisker diagram, provides a simple graphical summary of a set of data and is a standardized way of displaying the distribution of data based on the five number summary: minimum, first quartile, median, third quartile, and maximum. It shows a measure of central location the median), the average, and measures of dispersion. In the simplest box plot the central rectangle spans the first quartile to the third quartile (the interquartile range or IQR). A segment inside the rectangle shows the median and "whiskers" above and below the box show the locations of the minimum and maximum. Box plots are especially useful when comparing two or more sets of data.
Subscribe to:
Post Comments (Atom)
No comments:
Post a Comment