Sunday, August 3, 2008

TOPOGRAPHIC MAP

A Topographic Map is a type of map characterized by large-scale detail and quantitative representation of relief, usually using contour lines in modern mapping, but historically using a variety of methods. Traditional definitions require a topographic map to show both natural and man-made features.

This image is a Topographic Map of Romania showing the different elevations of this land. For those of us not familiar with Romania, listed below are a few interesting tidbits of information about Romania:
  • Romania is located in Southeastern Europe, bordering the Black Sea, between Bulgaria and Ukraine, comprising of 237,500 sq km.
  • Romania has a population of 22,329,977 (2005).

THEMATIC MAP

A Thematic Map shows the spatial distribution of one or more specific data themes for standard geographic areas. The map may be qualitative in nature (e.g., predominant farm types) or quantitative (e.g., percentage population change). In contrast to reference maps which show many geographic features (forests, roads, political boundaries), thematic maps emphasize spatial variation of one or a small number of geographic distributions.

This Thematic Maps shows the population percent change in the United States between 1990 and 1996. The source of the data is the USDC, Bureau of the Census.

UNSTANDARDIZED CHOROPLETH MAP

An Unstandardized Choropleth Map portrays areal data, and is not areally averaged in any way. The Areal divisions are often boundaries like census tracts, counties, states.

This Unstandardized Choropleth Map shows the acres of forage (hay, silage, etc.) The map is showing that the total hay or silage acres in each county is more regionally diffuse, since it proportionately favors the largest counties, notably those in central California, southeastern Oregon, and the northern Plains.

SIMILARITY MATRIX

A similarity matrix, a type of geovisualization, is a matrix of scores which express the similarity between two data points. Similarity matrices are used in sequence alignment. Higher scores are given to more-similar characters, and lower or negative scores for dissimilar characters.

This image is a similarity matrix of the song by the Beatles, “Hey Jude”. This Similarity Matrix was designed to show the repetition parts. Noted observations are:
  • The "deep blue" part along the off-diagonal lines of similarity matrix represents repeating parts.
  • The chorus is easier to detect from the similarity matrix than the verse.
  • The dissimilar part between very similar parts is usually instrument playing without vocal sounds.

STANDARDIZED CHOROPLETH MAP


A Standardized Choropleth map portrays areal data, and is areally averaged (i.e. Density-persons per square mile, percentages). The Areal divisions are often boundaries like census tracts, counties, states.

This Standardized Choropleth Map shows Canada – Percentage of Population Aged 14 and Under. The data used for this map is from the 2006 Census Data.

CONTINUOUSLY VARIABLE PROPORTIONAL CIRCLE MAP

A Continuously Variable Proportional Circle Map is a proportional circle map, where we point data mapped with a circle instead of a dot, and there are not a finite or set number of sizes used for the circles. The circles can come in all sizes.

This image is a map Continuously Variable Proportional Circle Map of the 2002 Gorilla Groups Locations in Uganda. Each circle represents one group, with the size of the circle proportional to the size of the group.

RANGE-GRADED PROPORTIONAL CIRCLE MAP

A Range-Graded Proportional Circle Map is a proportional circle map, where we point data mapped with a circle instead of a dot, and there are a finite or set number of sizes used for the circles.

This image is a map Range-Graded Proportional Circle Map of Filipino Population for selected states in the year 2000. The data comes from the 2000 Census Bureau.

DLG (Digital Line Grap)

DLGs (Digital Line Graphs) are digital vector representations of topographic and planimetric map features derived from either aerial photographs or from cartographic source materials such as USGS maps ad related sources, using manual and automated digitizing methods.

This image is a Digital Line Graph (DLG) with raster text scanned from mylar separate. Separate feature layers allow for selection or omission of map features, and the vector data provides high quality line work for publication of geological maps.

CARTOGRAM

A cartogram is a map in which some thematic mapping variable – such as travel time or Gross National Product – is substituted for land area. The geometry or space of the map is distorted in order to convey the information of this alternate variable. There are two main types of cartograms: area and distance cartograms.

This is an image of the World economy cartogram. To highlight the distribution of wealth and power in the world of today, this cartogram sizes the countries according to their relative financial status, here presented through gross domestic product (gdp) per capita, offering an alternative world view to a regular map. Countries such as China and India become much smaller, next to giants in Western Europe, North America and Japan. Africa represents a minor speck, while South and Central America lands somewhere in between.

BATHYMETRIC MAP

A Bathymetric Map is a map that accurately depicts all of the various depths of a water body. A bathymetric map or chart usually shows floor relief or terrain as contour lines (called depth contours or isobaths), and may additionally provide surface navigational information. Color-coding to show the different depths of water is a common methodology used in bathymetric maps.

This image is a Bathymetric map of Lake Tahoe CA/NV. In this image, areas where the bottom is visible are colored red and green (greater bottom reflectance is shown in red). Where the lake is blue the bottom cannot be seen. The depth to which the bottom is visible varies depending on the clarity of the water.

Saturday, August 2, 2008

DEM (Digital Elevation Model) MAP

A digital elevation model (DEM) is a digital representation of ground surface topography or terrain. A DEM can be represented as a raster (a grid of squares) or as a triangular irregular network. DEMs are commonly built using remote sensing techniques, however, they may also be built from land surveying. DEMs are used often in geographic information systems, and are the most common basis for digitally-produced relief maps.

This image is a Digital elevation Model of the Hartnett Study Site. It displays the topography of the Hartnett study site in three dimensions. The model was created by digitizing a georeferenced DRG (Digital Raster Graphic) in Arcview GIS.

METES AND BOUNDS SURVEY MAP

The most well known unsystematic cadastral method for surveying land is metes and bounds. It is no longer practiced, but much of the US was initially surveyed in metes and bounds. Metes are units of distance and bounds (names of markers) are used to divide up land according to ownership. Since there is typically a strong reliance on landscape features, which could and often did change, move or no longer exist over time, this survey method was considered very problematic.

This image is an example of a Metes and Bounds Survey Map. The metes given are 45° southwest, 30 chains. A chain is a unit of measurement sixty-six feet long. There are eighty chains to the mile. The bound is the felled maple.

SYSTEMATIC PUBLIC LAND SURVEY SYSTEM

The Public Land Survey System (PLSS) is used to divide public domain lands, which are lands owned by the Federal government for the benefit of the citizens of the United States. The PLSS typically divides land into 6-mile-square townships, which is the level of information included in the National Atlas. Townships are subdivided into 36 one-mile- square sections. Sections can be further subdivided into quarter sections, quarter-quarter sections, or irregular government lots. Normally, a permanent monument, or marker, is placed at each section corner. The PLSS is a good example of a systematic land partitioning (cadastral) system. The reason this map is considered “systematic” is because the sections are divided using a systematic methodology.

This data for this systematic public land survey system shows the township, range, and sections for the majority of the state of Indiana, with a small gap in northeast Indiana.

CADASTRAL MAP

A cadastral map is a map showing the boundaries and ownership of land parcels. Some cadastral maps show additional details, such as survey district names, unique identifying numbers for parcels, certificate of title numbers, positions of existing structures, section and/or lot numbers and their respective areas, adjoining and adjacent street names, selected boundary dimensions and references to prior maps.

This particular Cadastral Map is an image of Agricultural fields near Campobasso – Italy.

NOMINAL AREA CHOROPLETH MAP


This is an image of a Nominal Area Choropleth Map. This map is nominal because there is no implicit ordering of groupings; it is a qualitative classification of groups.

This image is a political map of Africa. There is no particular hierarchy or order of the political affiliations represented on this map; therefore it is considered nominal.

UNCLASSIFIED CHOROPLETH MAP

In an Unclassified Choropleth Map the numeric attribute values are converted directly into proportional degrees of darkness, i.e. the higher the object's attribute value, the darker the shade representing it.

This Unclassified Choropleth Map shows the fertility rate attribute values for countries in Europe. The maximum fertility rate is 2.27 children born per woman in Albania and is represented by the darkest shade of orange and the minimum fertility rate is 1.13 children born per woman in Bulgaria represented by the lightest shade of orange.

CLASSED CHOROPLETH MAP

In a Classed Choropleth Map, areal units are combined into a smaller number of groups and portrayed in intervals.

This Classed Choropleth Map shows the percent of people who are Hispanic per county in Florida based on Census data from 2000. This image’s areal unit is the county, and there are five, natural break, classification intervals. That means the groups are divided into unequally sized groups that attempt to group like data together.

UNIVARIATE CHOROPLETH MAP

This is an image of a Univariate Choropleth Map, which is also known as a thematic map. This univariate Choropleth map displays the spatial distribution of an attribute that relates to a single topic, theme, or subject of discourse. More specifically, this image represents the population density in a given area.

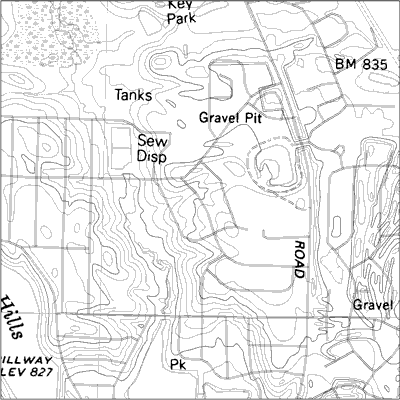
DRG (Digital Raster Graphics)

This is an image of a DRG, which is a digital raster graphic. A digital raster graphic (DRG) is a scanned image of a U.S. Geological Survey (USGS) standard series topographic map, including all map collar information. The image inside the map neatline is georeferenced to the surface of the earth. The horizontal positional accuracy and datum of the DRG matches the accuracy and datum of the source map. The map is scanned at a minimum resolution of 250 dots per inch.

This map is a part of the Washington West, D.C. Digital Raster Graphic (DRG).

MENTAL MAP

Mental maps are an individual's internalized representation (a person’s point of view) of some aspects of the Earth's surface. It represents what the person knows about the locations and the characteristics of places at a variety of scales (local to global) from the layout of the one's bedroom to the distribution of oceans and continents on the surface of the Earth.

This image is a Mental map of the West part of the United States. The person who created the map based this map on what he perceived the West to be, as someone who has lived in Colorado and Arizona his whole life and had traveled extensively throughout the region.

PARALLEL COORDINATE GRAPH

Parallel coordinate plots are a type of geovisualization that can be used to explore relationships among variables by plotting large multivariate datasets. A parallel coordinate graph is used to plot large multivariate datasets. Each variable in the data plot is represented as its own Y Axis on the graph. A maximum point for each Y axis is selected, and they are scaled relatively to each other so that each variable takes up the same area in the graph space. The strength of parallel coordinates isn't in their ability to communicate some truth in the data to others, but rather in their ability to bring meaningful multivariate patterns and comparisons to light when used interactively for analysis.

This image is a Parallel Coordinate Graph of Baseball statistics. For example, each Y Axis is labeled with a particular baseball statistic (i.e. Homeruns, RBIs, etc). The value labeled at the top of each Y axis represents the player with the highest value in that category. A scaling factor is applied to the y value in an (x,y) point, so that all of the statistics are relative in value to each other in the graph. Each line drawn represents a single player. More precisely, a line is represented by the values of each of a player's statistics.