Friday, July 25, 2008

TRIANGULAR PLOT

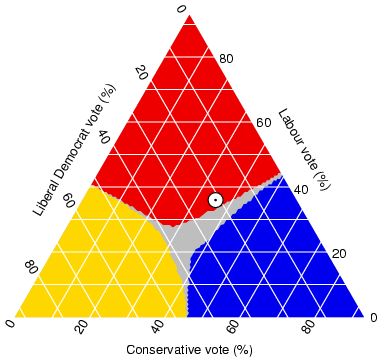
This is an image of a Triangular Plot, which is a type of geovisualization. A Triangular Plot plots three distinct variables.

This Triangular Plot is an estimate of the probable outcome of the (British) election, based on 2005 opinion polls recorded on Anthony Well’s website. The axes of the figure show the estimated fraction of the population intending to vote for each of the major parties; the white circle shows the current estimate from opinion polls. The colored areas show the regions of the plot in which -- under the assumption of uniform national swing -- each of the corresponding major parties would win a majority in Parliament.

LORENZ CURVE (ACCUMULATIVE LINE GRAPH)

This is an image of a Lorenz Curve, which is a form of geovisualization. A Lorenz Curve is commonly used in economics and ecology to describe inequality in wealth or size. The Lorenz curve is a function of the cumulative proportion of ordered individuals mapped onto the corresponding cumulative proportion of their size.

This Lorenz Curve is an image found on The North Lanarkshire Council website, which reflects fairness in terms of income in Scotland. For example, if everyone in Scotland had an equal amount of money, we would have a Lorenz Curve like the Perfect Equality line where 10% of the population have 10% of the income, and so on. Complete inequality, where one person has all the money in Scotland, would be a straight line along the bottom of the graph.

LINE GRAPH

This is an image of a line graph, which is a type of geovisualization. Line graphs are commonly used to visualize activity in the stock market. This line graph shows the Dow Jones Industrial Average (DJIA) during a 20-year period from 1985 to 2005.

A line graph is like a scatter plot, except that its data points are connected by a line. Line graphs compare two variables. Each variable is plotted along an axis. A line graph has a vertical axis and a horizontal axis. Some of the strengths of line graphs are that:

  • They are good at showing specific values of data, meaning that given one variable the other can easily be determined.
  • They show trends in data clearly, meaning that they visibly show how one variable is affected by the other as it increases or decreases.
  • They enable the viewer to make predictions about the results of data not yet recorded.

SCATTER PLOT

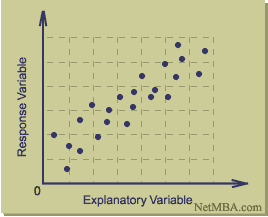
This is an image of a Scatter Plot (or Scatter Graph). It is a type of geovisualization that displays values for two variables for a set of data. A scatter plot only specifies variables or independent variables when a variable exists that is under the control of the experimenter. The data is displayed as a collection of points, each having the value of one variable determining the position on the horizontal axis and the value of the other variable determining the position on the vertical axis.

This Scatter Plot was produced by Six Sigma. Six Sigma is a data-driven quality methodology for eliminating defects in any process, may it be in manufacturing or service organizations.

WIND ROSE


This image is an example of a Wind Rose, which is a type of geovisualization in the form of a circular plot. The winds are displayed in a form of concentric wedges, split into segments reflecting wind speed. The area of each segment is proportional to the total time of wind falling into specific speed/direction category.

This Wind Rose was produced by NOAA’s National Weather Service Weather Forecast office for Springfield, Missouri. In particular, it shows the average Wind Direction for Springfield in the month of March.

Thursday, July 24, 2008

STAR PLOT

This image is an example of a Star Plot of automobile data and includes 12 numeric variables in the automobile data. Each star represents one car model and each ray in the star is proportional to one variable.

Star Plots are a type of geovisualization that allow you to compare multiple variables for each observation. Each observation is represented as a star-shaped figure with one ray for each variable. A legend often accompanies a Star Plot to identify what the variables are and in what location (or on what ray) each variable is represented (though a legend is not provided in this blog).

HISTOGRAM


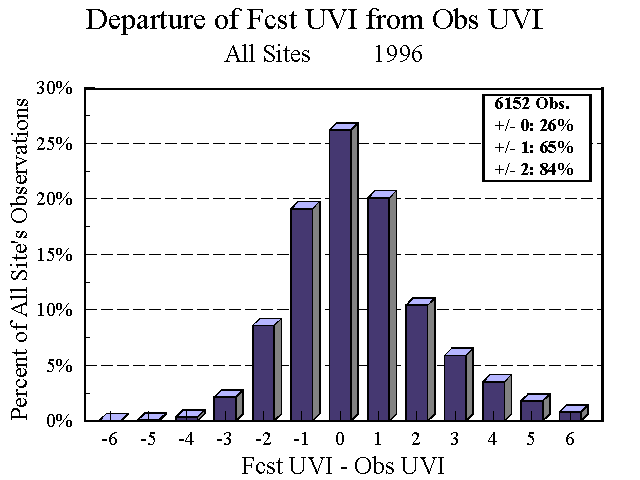
This is an image of a histogram. A histogram is a type of geovisualization that displays tabulated frequency. Each year the National Weather Service performs a validation of the summer time UV Index forecasts. This histogram records the all the differences between the observation sites and the forecasts. The histogram shows that 26% of the time the UV Index is exactly correct. 65% of the time the UV Index forecast is within ± 1 UV Index unit. And 84% of the time the UV Index is within ± 2 UV Index units.