Saturday, August 2, 2008

NOMINAL AREA CHOROPLETH MAP


This is an image of a Nominal Area Choropleth Map. This map is nominal because there is no implicit ordering of groupings; it is a qualitative classification of groups.

This image is a political map of Africa. There is no particular hierarchy or order of the political affiliations represented on this map; therefore it is considered nominal.

UNCLASSIFIED CHOROPLETH MAP

In an Unclassified Choropleth Map the numeric attribute values are converted directly into proportional degrees of darkness, i.e. the higher the object's attribute value, the darker the shade representing it.

This Unclassified Choropleth Map shows the fertility rate attribute values for countries in Europe. The maximum fertility rate is 2.27 children born per woman in Albania and is represented by the darkest shade of orange and the minimum fertility rate is 1.13 children born per woman in Bulgaria represented by the lightest shade of orange.

CLASSED CHOROPLETH MAP

In a Classed Choropleth Map, areal units are combined into a smaller number of groups and portrayed in intervals.

This Classed Choropleth Map shows the percent of people who are Hispanic per county in Florida based on Census data from 2000. This image’s areal unit is the county, and there are five, natural break, classification intervals. That means the groups are divided into unequally sized groups that attempt to group like data together.

UNIVARIATE CHOROPLETH MAP

This is an image of a Univariate Choropleth Map, which is also known as a thematic map. This univariate Choropleth map displays the spatial distribution of an attribute that relates to a single topic, theme, or subject of discourse. More specifically, this image represents the population density in a given area.

DRG (Digital Raster Graphics)

This is an image of a DRG, which is a digital raster graphic. A digital raster graphic (DRG) is a scanned image of a U.S. Geological Survey (USGS) standard series topographic map, including all map collar information. The image inside the map neatline is georeferenced to the surface of the earth. The horizontal positional accuracy and datum of the DRG matches the accuracy and datum of the source map. The map is scanned at a minimum resolution of 250 dots per inch.

This map is a part of the Washington West, D.C. Digital Raster Graphic (DRG).

MENTAL MAP

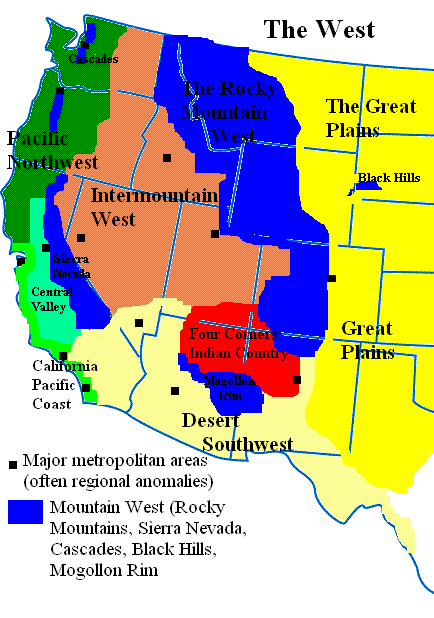
Mental maps are an individual's internalized representation (a person’s point of view) of some aspects of the Earth's surface. It represents what the person knows about the locations and the characteristics of places at a variety of scales (local to global) from the layout of the one's bedroom to the distribution of oceans and continents on the surface of the Earth.

This image is a Mental map of the West part of the United States. The person who created the map based this map on what he perceived the West to be, as someone who has lived in Colorado and Arizona his whole life and had traveled extensively throughout the region.

PARALLEL COORDINATE GRAPH

Parallel coordinate plots are a type of geovisualization that can be used to explore relationships among variables by plotting large multivariate datasets. A parallel coordinate graph is used to plot large multivariate datasets. Each variable in the data plot is represented as its own Y Axis on the graph. A maximum point for each Y axis is selected, and they are scaled relatively to each other so that each variable takes up the same area in the graph space. The strength of parallel coordinates isn't in their ability to communicate some truth in the data to others, but rather in their ability to bring meaningful multivariate patterns and comparisons to light when used interactively for analysis.

This image is a Parallel Coordinate Graph of Baseball statistics. For example, each Y Axis is labeled with a particular baseball statistic (i.e. Homeruns, RBIs, etc). The value labeled at the top of each Y axis represents the player with the highest value in that category. A scaling factor is applied to the y value in an (x,y) point, so that all of the statistics are relative in value to each other in the graph. Each line drawn represents a single player. More precisely, a line is represented by the values of each of a player's statistics.