Thursday, July 24, 2008

INFRARED AERIAL PHOTO


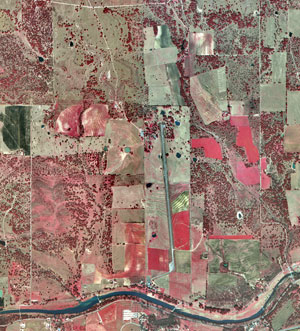
This is an image of a 1995 infrared aerial photo of Lyndon B. Johnson (LBJ) Ranch in Gillespie County. Infrared (IR) emulsion is sensitive to wavelengths that fall outside the range of human vision. IR film is commonly used to produce color-infrared photos. IR imagery uses false color, since we can’t really see the wavelengths recorded on infrared film. Features that may have similar shades of grey in black and white aerial photos will be much more distinguishable with IR film.

Monday, July 21, 2008

BOX PLOT

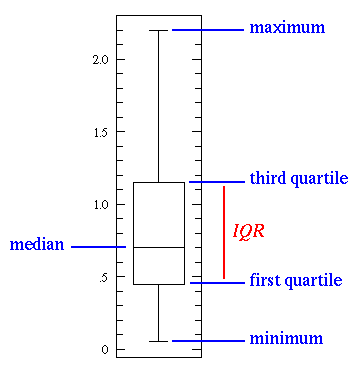
This image is an example of a box plot. A box plot, or box and whisker diagram, provides a simple graphical summary of a set of data and is a standardized way of displaying the distribution of data based on the five number summary: minimum, first quartile, median, third quartile, and maximum. It shows a measure of central location the median), the average, and measures of dispersion. In the simplest box plot the central rectangle spans the first quartile to the third quartile (the interquartile range or IQR). A segment inside the rectangle shows the median and "whiskers" above and below the box show the locations of the minimum and maximum. Box plots are especially useful when comparing two or more sets of data.

CLIMOGRAPH

A climograph is a type of geovisualization. It is a graphic representation of the relation between temperature and precipitation as plotted at monthly intervals throughout the year. This image shows us the Wet-Dry Tropical / Tropical Savanna climate: Timbo, Guinea, at lat. 10N, West Africa. Looking at the map, we can see that a wet season at time of high sun alternates with an almost rainless dry season at time of low sun.

BLACK & WHITE AERIAL PHOTO

Aerial photographs are a type of remote sensing. In particular, the black and white mixture on an aerial photo is sensitive to approximately the same wavelengths as the human eye. This image is a black and white aerial photo of the University of Western Ontario (UWO) in 1930.

Wednesday, July 16, 2008

STEM AND LEAF PLOT

Stem-and-leaf plots are considered a geovisualization type map. They can tell you how the variable is distributed in the population. For example, this stem-and-leaf plot of student marks is fairly symmetric with short tails although there was also an outlier. To understand the values represented, you take the number to the left of the bar and place each value in the horizontal row next to that value. For example, the first row of numbers represented is: 90 and 96.

CHOROPLETH MAP

This image is a Choropleth map, which is the most common type of statistical map. Choropleth maps portray areal data. Areal divisions are often boundaries like census tracts, counties, states.

This map shows the amount of spending (in millions) by overseas residents in 2003, and it classifies the data into five intervals. Typically four to seven intervals are used, and this map is well within the standards of Choropleth maps.

Monday, July 14, 2008

INDEX VALUE PLOT

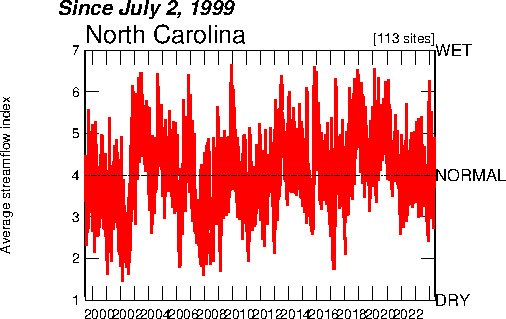
An index value plot is a geovisualization map that plots the departures relative to a given index value. This index value plot measures the average streamflow index. The average streamflow index, plotted as the red line on the above graph, is calculated each day as the average of the streamflow index values for all the stream gaging stations in the state or water source region having at least 30 years of record. The streamflow index value at a station compares the real-time streamflow value to historical values for the day of the year.